FX Options: An Alternative Way to Trade FX for Retail and Financial Institutions
(published on CME Group's website)
15 Sep 2020 - Thomas Poh
It has been over six months since the COVID-19 pandemic hit the global economy and sent financial markets into one of the wildest rides ever seen. Extreme market volatility was seen across all markets with unprecedented markets dislocations. With the Fed’s intervention, by announcing QE Infinity in March, financial markets has since embarked on a dramatic turnaround. Gold and Nasdaq both hit all-time highs, while yields dropped to rock bottom. The FX market also went on a roller coaster ride. The DXY Dollar-index made a big reversal since its near 9% spike in March mainly driven the Fed’s relief measures, the eurozone’s agreement to a EUR 750 billion pandemic fund, and the escalation of the COVID-19 spread in the US
.
Click on the links below to read the full article
https://www.cmegroup.com/education/articles-and-reports/fx-options-an-alternative-way-to-trade-fx.html
https://www.cmegroup.com/education/articles-and-reports/navigating-the-choppy-markets-with-fx-options-a-retail-traders-perspective-on-fx-trading.html
Market Update - Is the bull market resurrected?14 Apr 2020 - Thomas Pohn the 24 Mar 2020, we published a market update titled: “Signs of Market Consolidation – 4 Interesting Charts” calling for the market to have found a potential base after the relentless selloff starting in the early part of March. The announcement of the Federal Reserve’s decision to embark on Unlimited Quantitative Easing, a.k.a “QE Infinity” as well as a host of other measures, like the provision of USD swaps credit lines to foreign central banks, seemed to have restored stability in the funding markets.
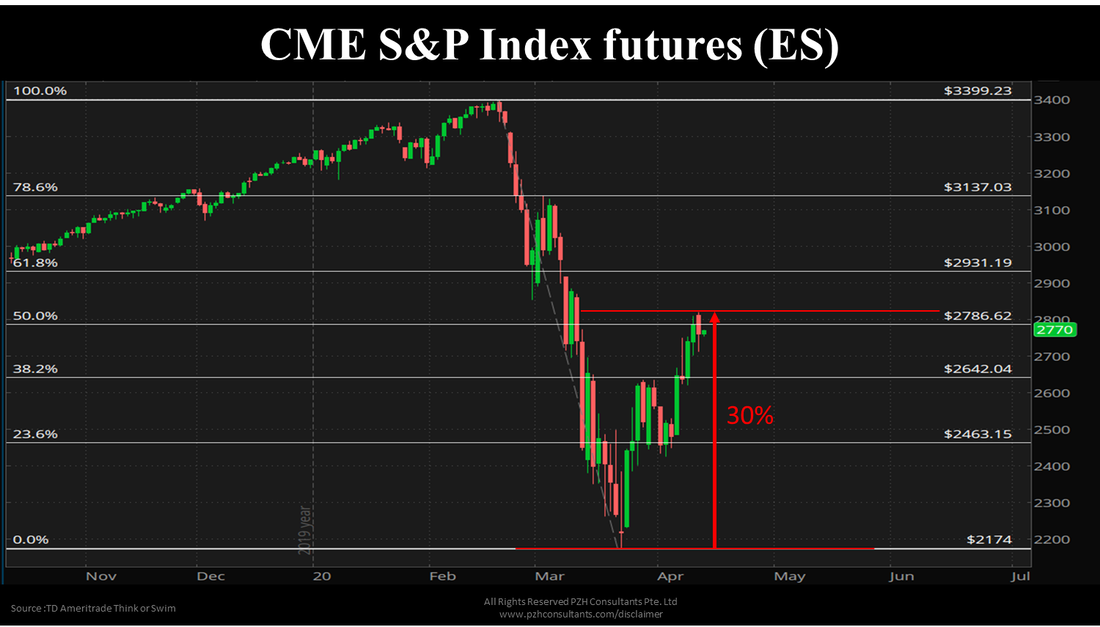
The market’s reaction since then was arguably just as fierce on the rebound. The S&P 500 index futures hit a high of 2818 on the 13th of April vs the low of 2174 registered on the 23rd of March. This is represents a 30% jump from the low. Technically, an increase of more than 20% from the previous low represents the start of a new bull market. However, as we had anticipated for the selloff to abate on the 24th of March, we would also now advise caution against over-optimism... ... Click on the link below to read the full article
|

| ||
Critical Trading Strategy Components – Part 2b13 Apr 2020 - Thomas PohIn previous session, we have covered the importance of recognising the time horizon which we plan our trade strategy. Defining our trading time horizon allows us to have the right time perspective when we assess the changes in the market vis-à-vis our strategy. It also helps us maintain discipline and prevent us over staying in our positions. In this second part of “Trading Time Horizons”, we shall touch on how it affects the other aspects of our trading.
Firstly, our time horizon affects how we calibrate our market analytical tools. ... ... Click on the link below to read the full article
|

| ||
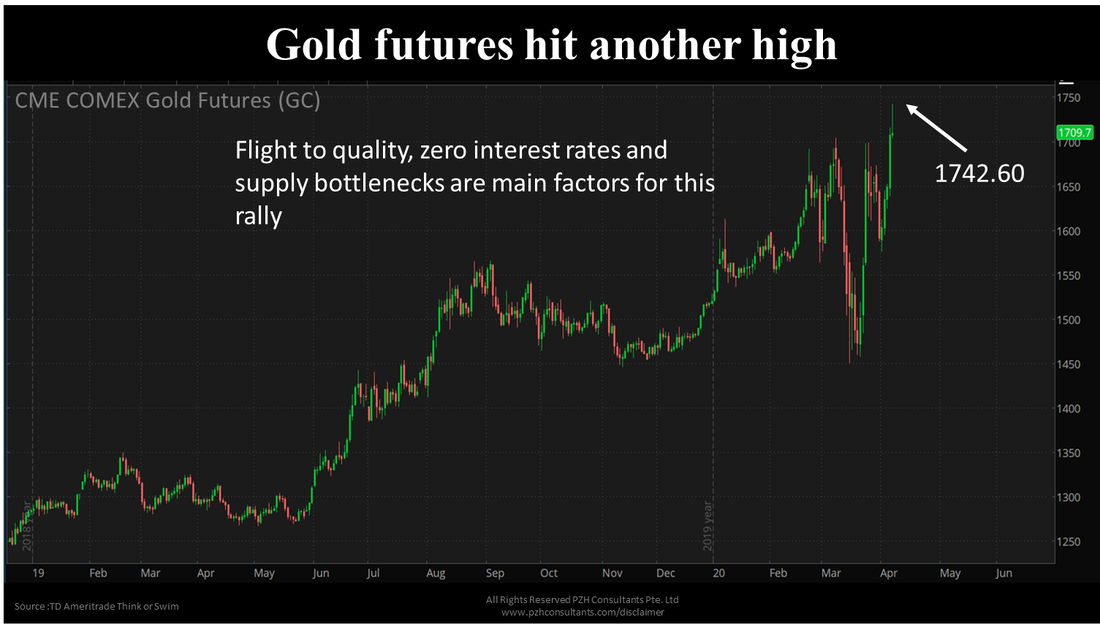
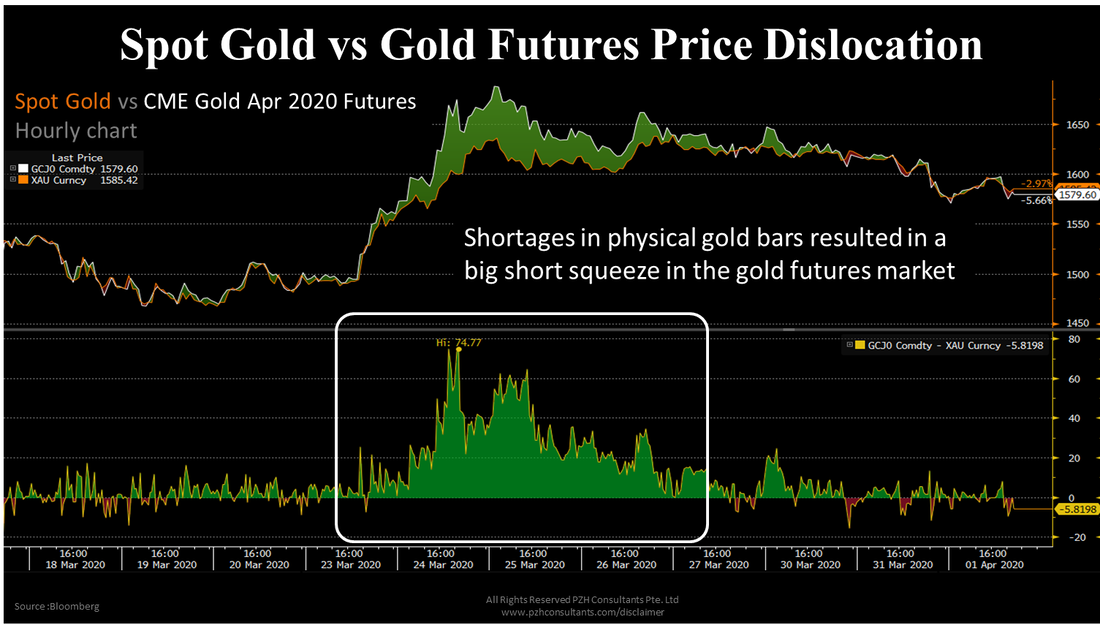
Driving the glittering gold trade
| |||
| gold_rally_7_apr_2020_cn.pdf |
Critical Trading Strategy Components – Part 2a6 Apr 2020 - Thomas PohWe have covered the importance of selecting the correct product to express our market view in our 2 previous sessions. Picking the wrong product is comparable to choosing the wrong tool for the task. The next component to be discussed is one that is VERY personal to the individual trader. It varies across traders and yet it seems to be the least discussed or mentioned when traders exchange their views or trading strategies. It is not an exaggeration to state that most traders do not even see this as a critical component of any trading strategy. This component is that of “Time Horizon”.
A trading strategy’s time horizon defines the time perspective in which we start building our market view. It would also set the timing of which we would expect the various scenarios, which we have envisioned, to pan out... ... Click on the link below to read the full article
|

| ||
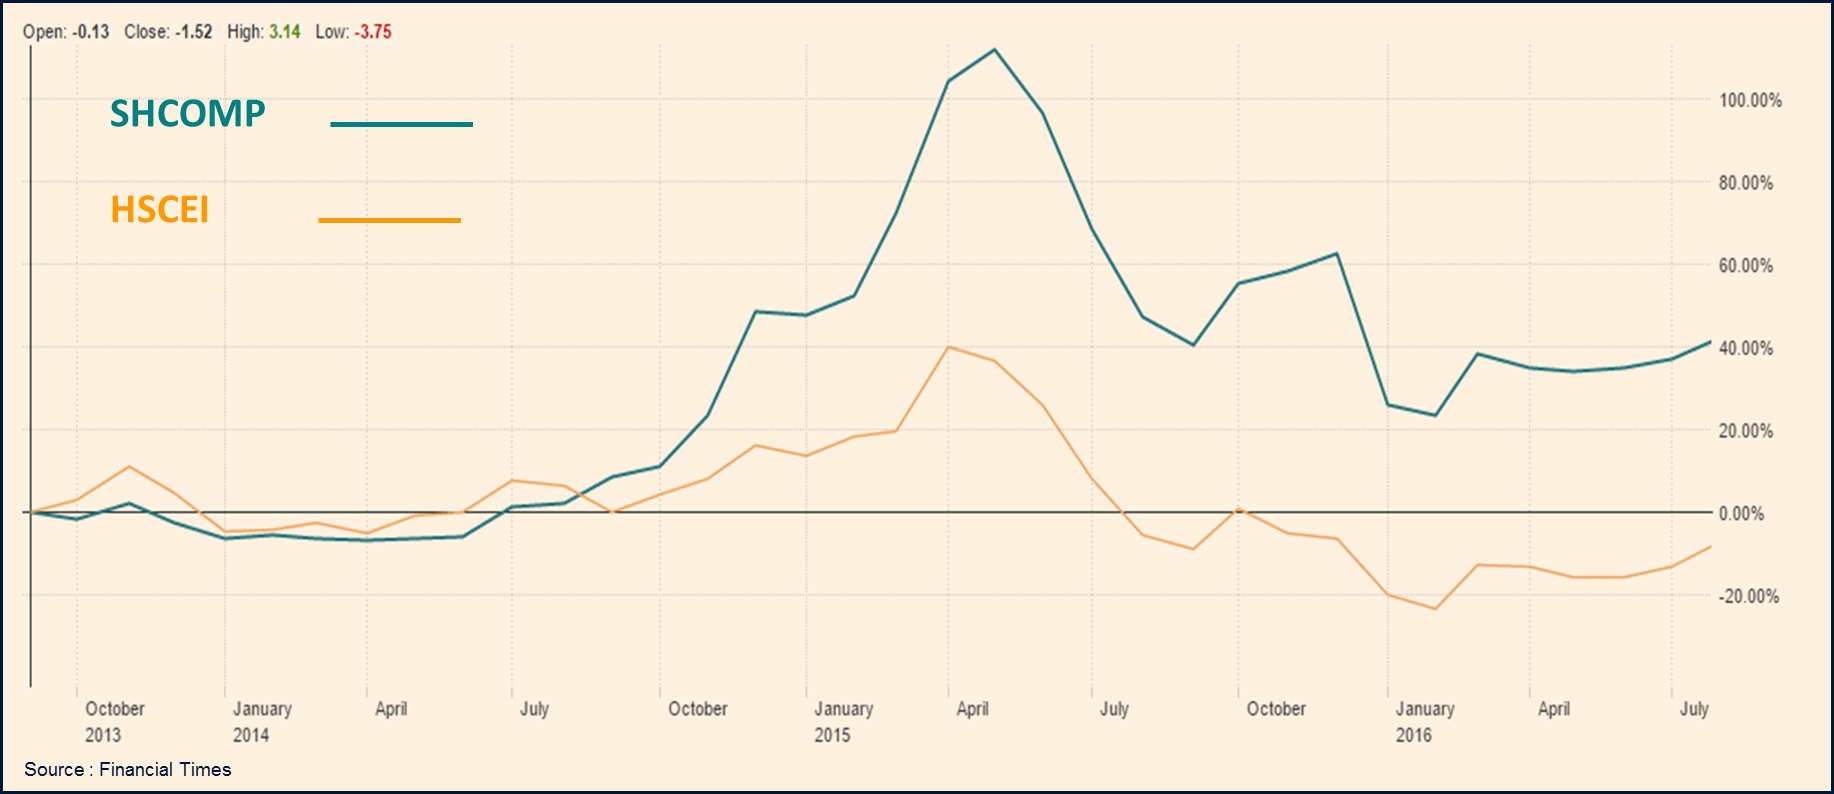
Critical Trading Strategy Components – Part 1b30 Mar 2020 - Thomas PohLast week I had highlighted to everyone that there is a lot more to a winning trading strategy than just determining the direction of the trade (click here for link to Part 1a). The relative performances between SHCOMP and HSCEI from 2014-2016 were used to illustrate how the underlying product chosen can determine the outcome of the trade strategy. In this follow up section on Product, I will illustrate that there is also more than one way to go long (or short) on a stock.
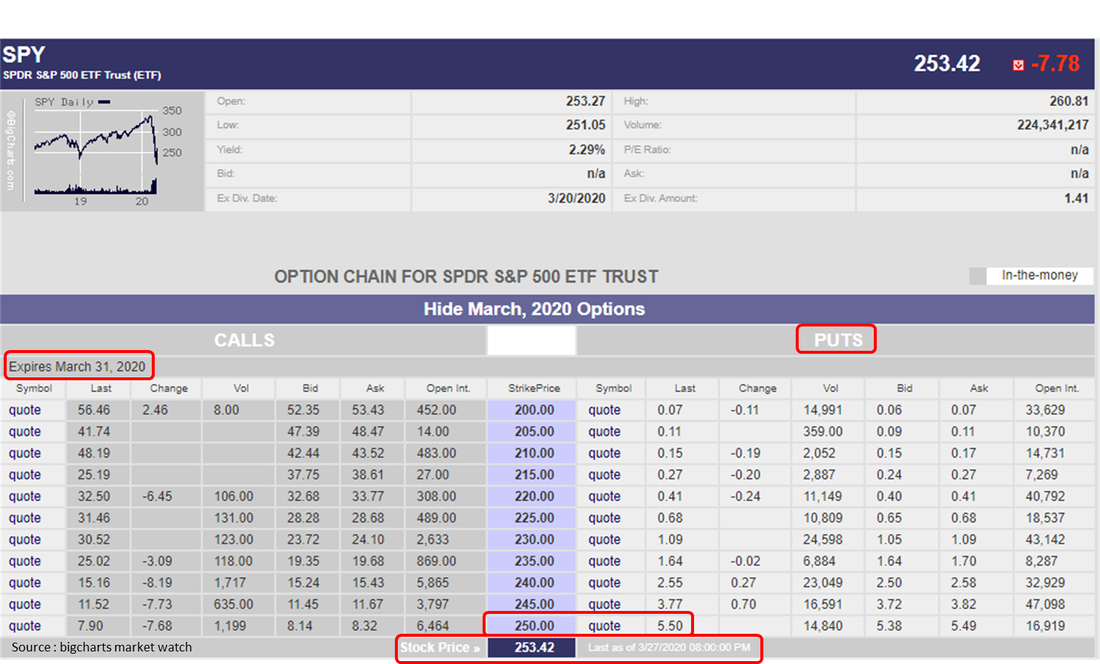
The most obvious way to express one’s bullish view on a stock is to buy it. This is what we called a physical or cash trade. However, depending on the circumstances, this may not always be the best way to express one’s bullish view. Again, the choice of the Product is important here. So what are the other ways to have a long position? Using the purchase of S&P index ETF to go long the S&P index as an example, I will illustrate are 3 other ways to be go long S&P index besides buying the ETF. Click on the link below to read the full article
|

| ||
“Critical Trading Strategy Components”- Part 1
|
26 Mar 2020 - Thomas Poh |
|
A lot of us talk about our market views and trading strategies but not many of us take a systematic approach towards planning and executing one. Let’s ask ourselves, how many times did we have the correct assessment of the market but yet came out short? What happened? I mean, we had the right view to begin with. Shouldn’t that should be half the battle won? Why did we end up not making or even losing money? A fellow trader once shared with me this saying, “The saddest thing that can happen in trading is to have the right view but yet lose money”. Wise words indeed. So what went wrong?
The answer is simply this. Having the right call of the market direction is nothing but the first step in forming the winning trading strategy. In fact, there are a few more components that form the trading strategy that are actually more critical than direction. It is arguable that one would even conclude that Direction is the least difficult component to decide because it is ultimately a digital decision. It is either up or down. |
In this series of “Critical Trading Strategy Components”, I shall share with you what the other components of a winning trade strategy are. We shall begin with “Product”.
Click on the link below to read the full article
| ||
Signs of Market Consolidation - 4 Interesting Charts
|
24Mar2020 - Thomas Poh |
The funding markets seem to have found a temporary footing as central banks attempted to counter the outbreak with their own shock and awe bazookas. The ECB unveiled an EUR 750bio bond purchase 5 days ago while the Fed announced unlimited quantitative easing yesterday as their latest salvo. The US Congress is also debating an up-sized USD2 trillion stimulus package.
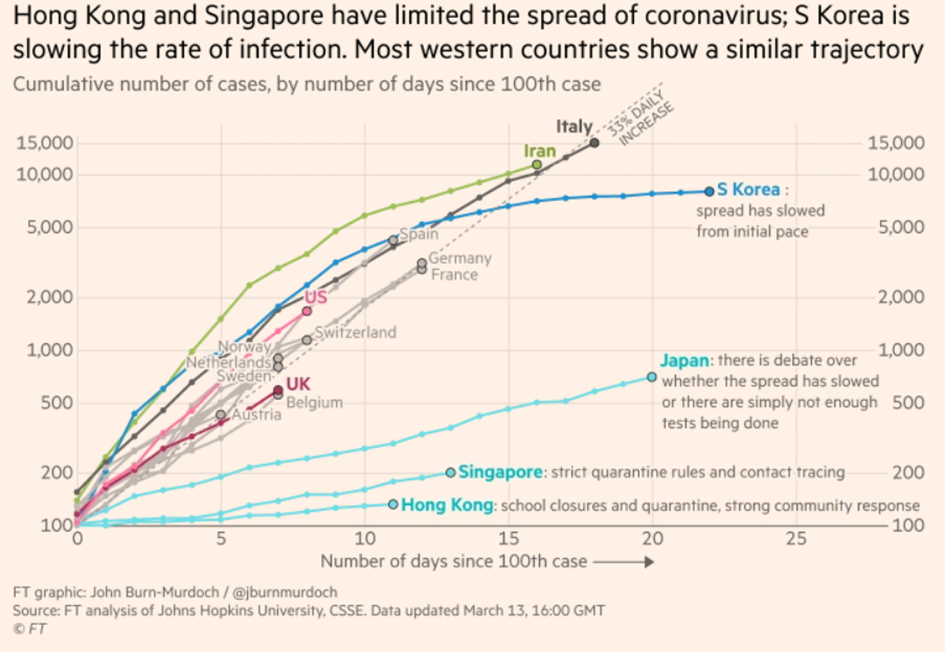
On the medical front, although the confirmed cases reported globally continue to rise together with the death toll, we have good news out of China where there is an announcement in the relaxation of the travel restrictions imposed on Wuhan.
All these sparked a rally in equities led by US equities futures which is currently up 5% in both the S&P 500 and Nasdaq at the time of this report writing. While it is unlikely that the bear trend in equities will end, given that the economic impact of this outbreak potentially overshadow that of the Global Financial Crisis, there are signs of the market reaching a temporary consolidation phase.
Below are 4 charts that might be interesting.
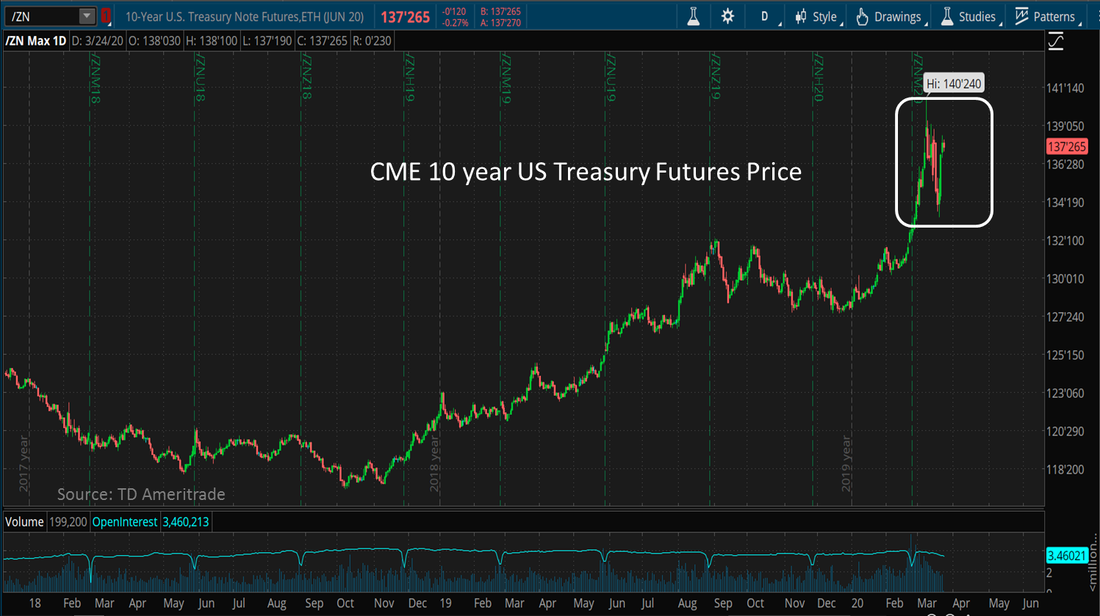
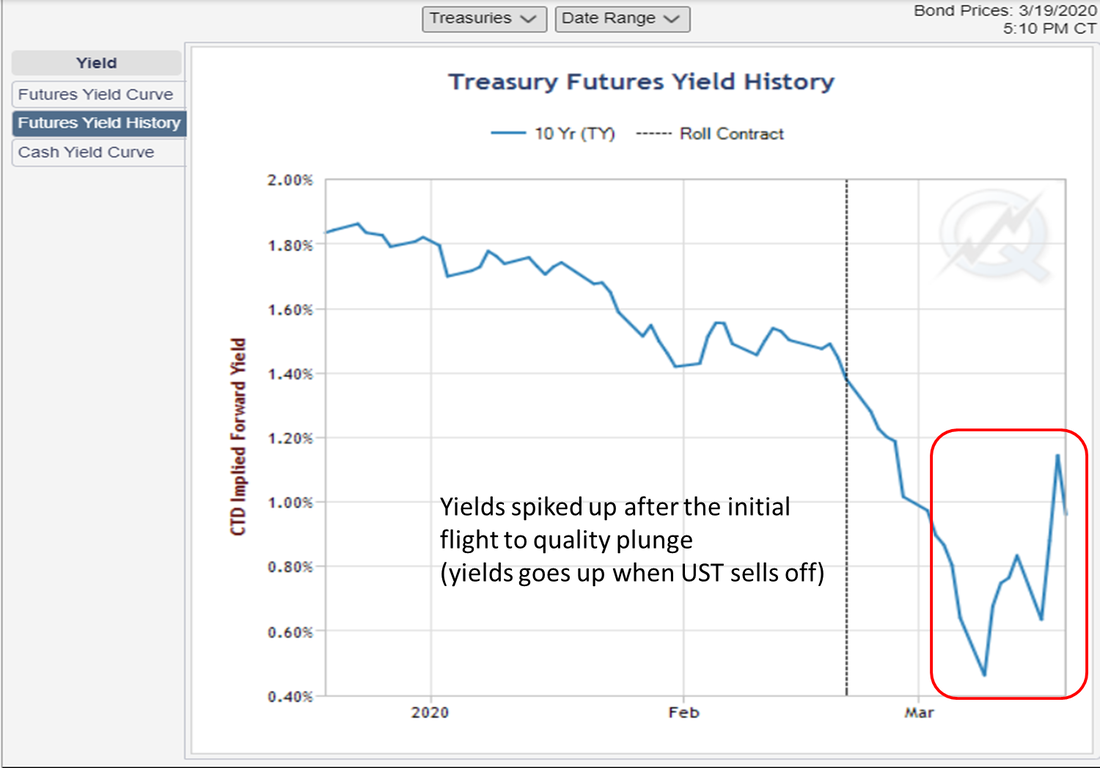
1) The US Treasuries (UST) finally reversed their selloff and rallied over the last 2 days (treasuries prices have an inverse relationship with yields). This a sign that the Fed's QE measure is restoring some calm in the market which saw heavy selling of Treasuries to raise cash. As we recall in my previous report, UST temporarily of its traditional flight to quality correlationship with equities during last 2 weeks' violent asset selloff because everyone was just selling everything to raise funding.
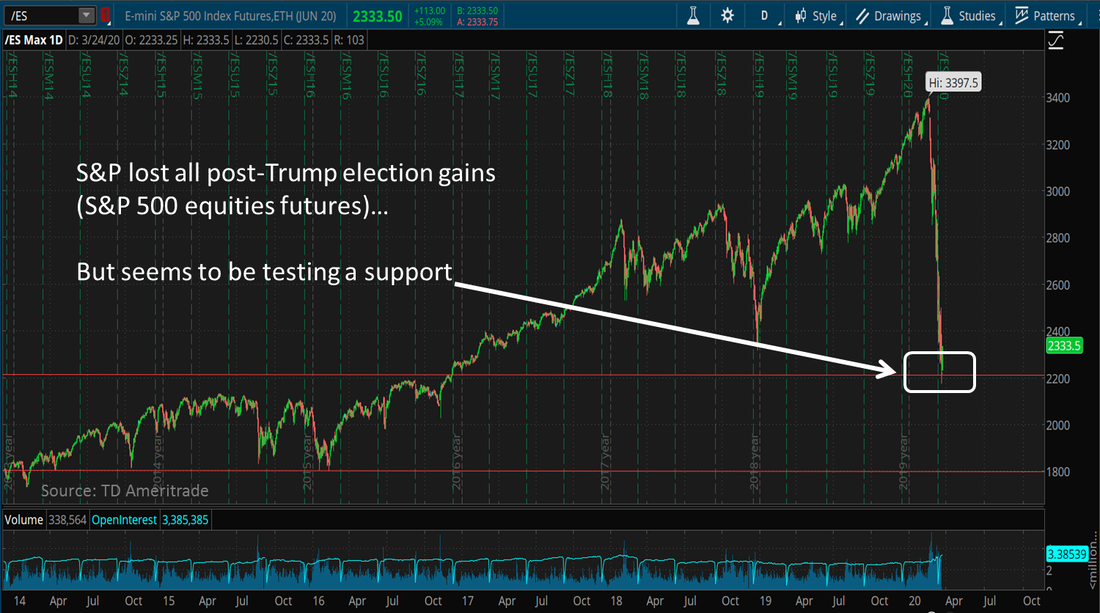
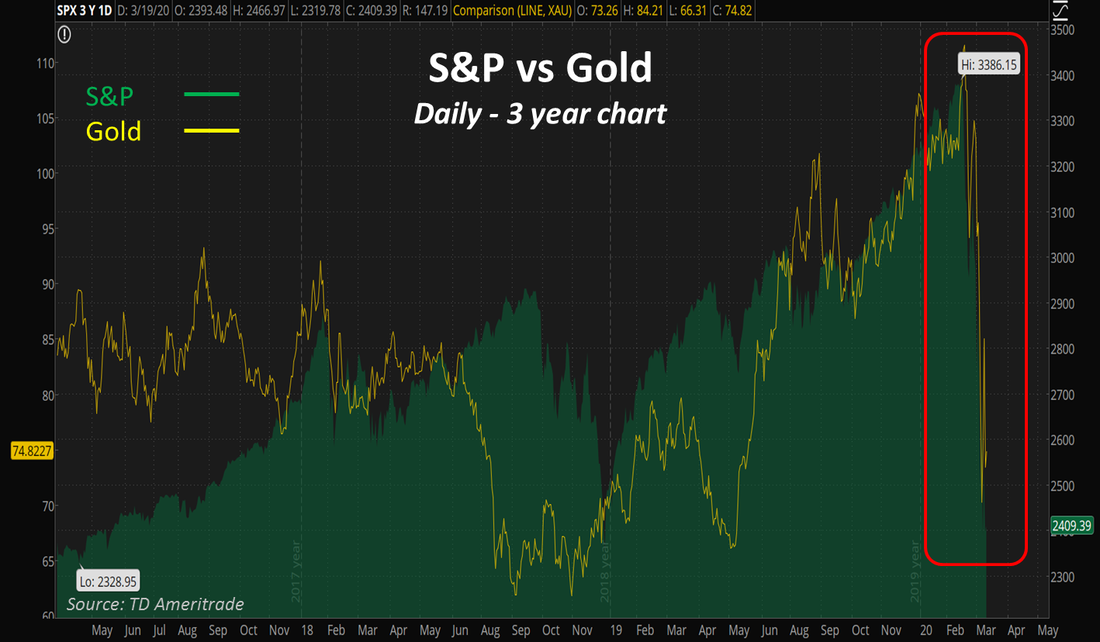
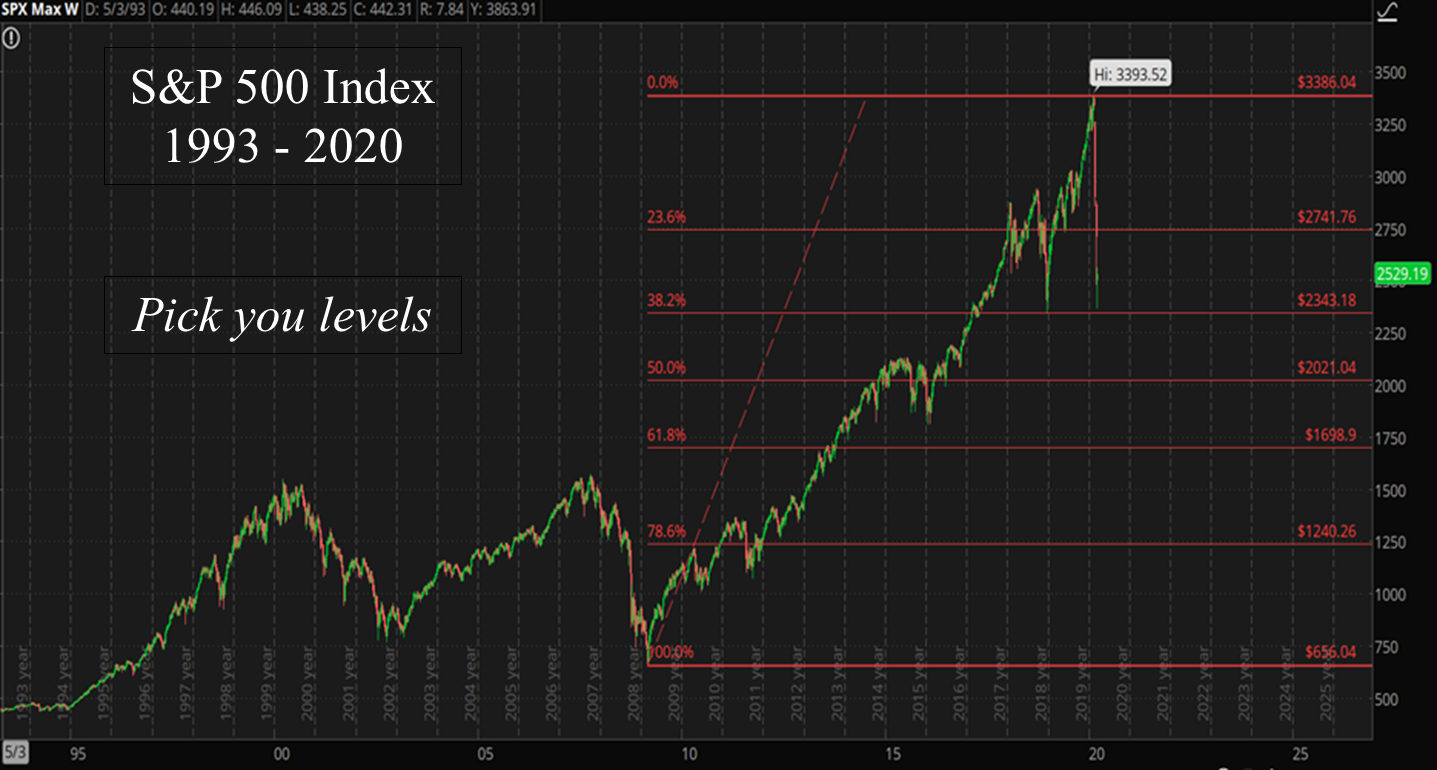
2) The stock market has lost ALL of the post-Trump election gains. We are hovering at the point of breakout of the Trump rally which started in 2016 which in turn forms a natural support. More interestly, if we zoom into the chart over the last 2 days... ...
|
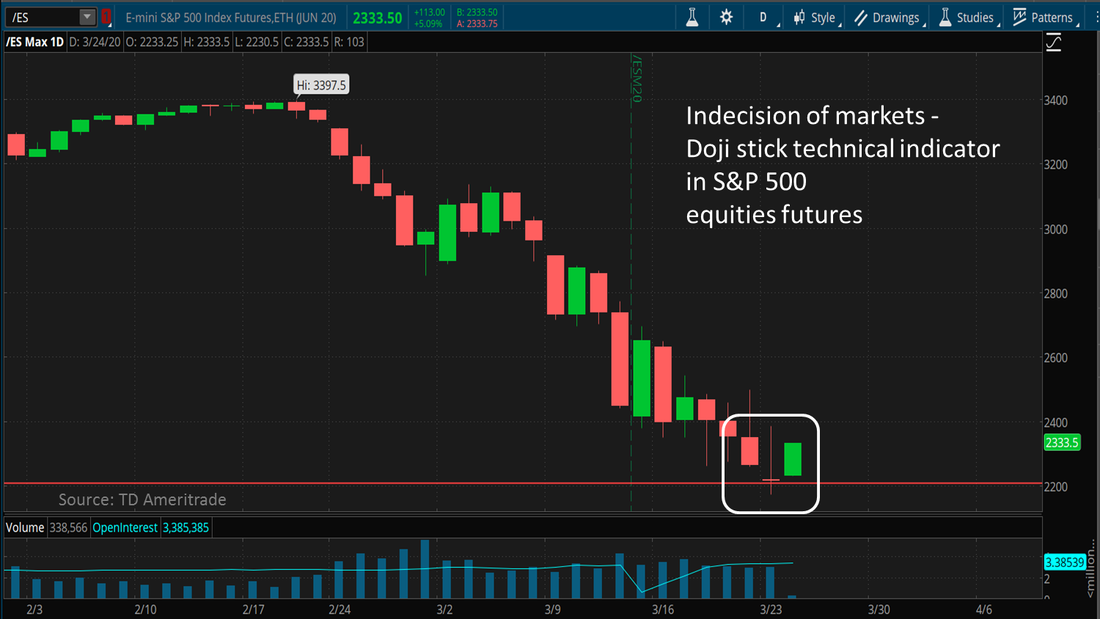
3) Doji stick technical indicator sighted yesterday. This is a sign of market INDECISION. Although this does not necessary signal a reversal, it does indicator that the market is struggling to make new lows in the recent selling trend.
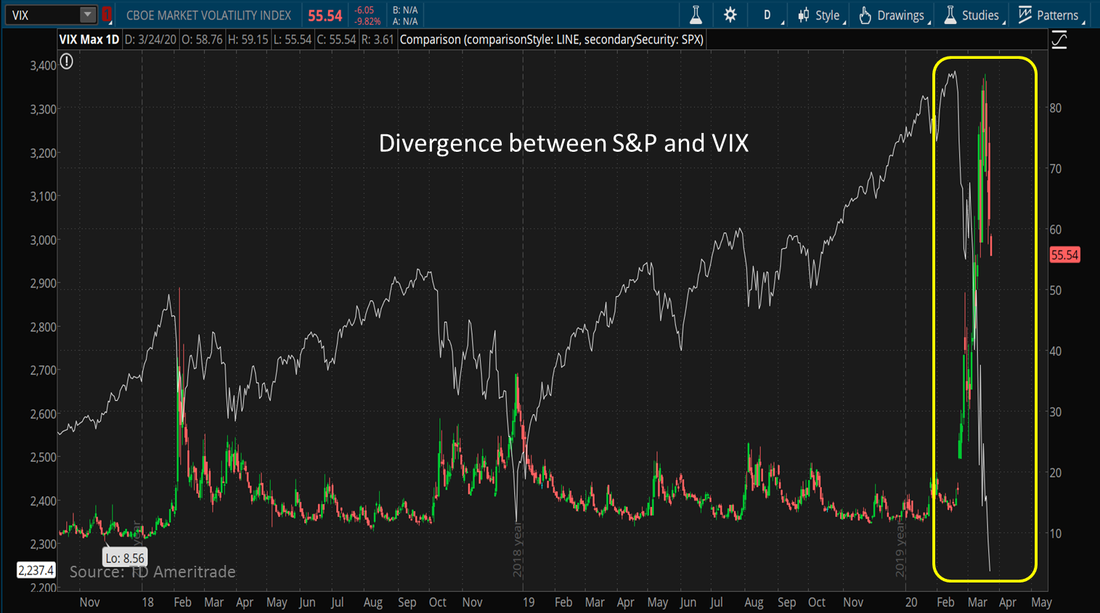
4) Divergence between S&P and VIX. The equities volatility index VIX also known as the "fear index" is reversing in spite of the continued selloff in equities over the last few days. Usually VIX climbs higher as volatility increases during equities selloffs. The fact that there is a divergence shows signs of market exhaustion for shorts.
Click on the link below to read the full market report
| ||
Bottom line: The bear trend in equities is still intact but there is risk that the market will go through a consolidation phase soon. Time to lock in some profits for short positions.
Indicator of the End of Market Panic - The Gold correlation
|
source : CME Group
|
Fight the Fear
| |||
| pzh_covid_mkt_update_18mar2020.pdf |
source : Financial Times
Source : TD Ameritrade - ThinkorSwim
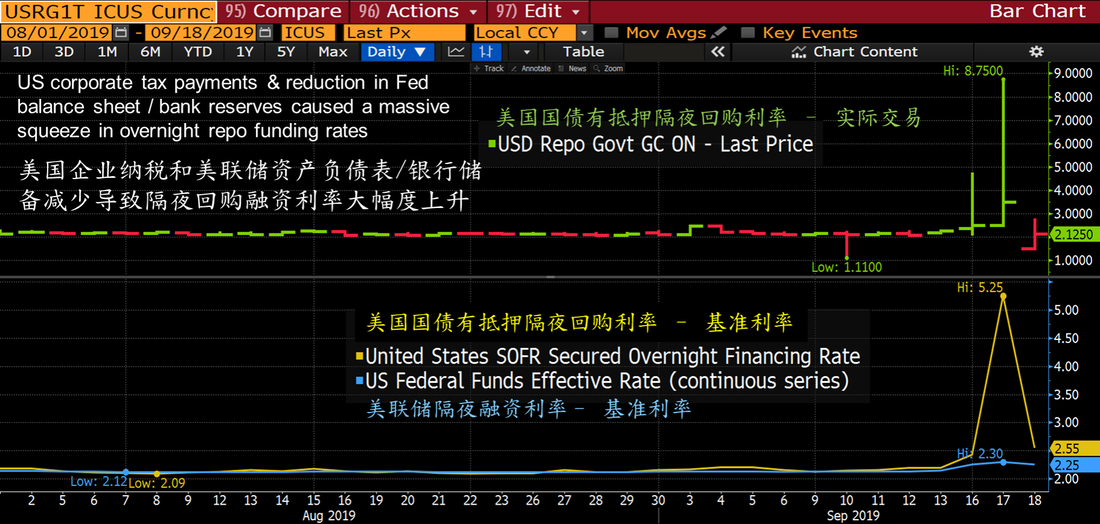
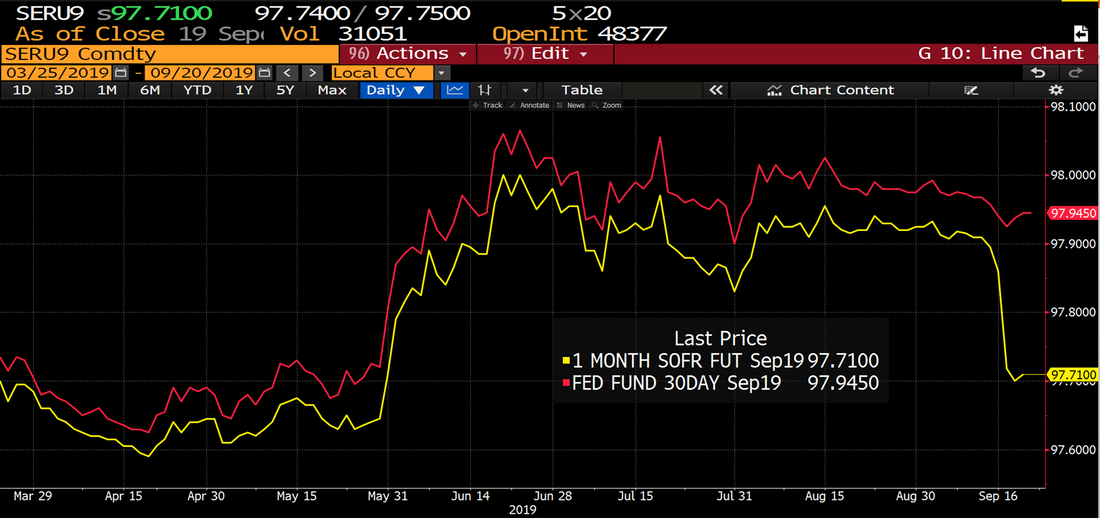
SOFR & Overnight Repo Spike18Sep2019 - Thomas PohThe recent spike in USD overnight repo rates is widely attributed to US corporate tax payment activities as well as the reduction in the Fed balance sheet which resulted in subsequent reduction in US banks cash reserves. As result, the Fed had to inject USD 75bio into the overnight market more than once in order to ease the squeeze. This event cast new light on the significance of the Secured Overnight Funding benchmark (SOFR) and SOFR Futures which was adopted in 2017 as the alternative to the now infamous LIBOR,. Fed Fund futures (and on the same note USD OIS) has been proven to be ineffective in its use as an hedge against USD overnight funding risks. SOFR, which is calculated based on transactions derived from the very same squeezed repo market, is a direct measurement of this funding risk. As such, CME SOFR futures and SOFR OIS are a more natural hedge against actual repo funding risk. Similarly, SOFR vs Fed Futures spread will be a key barometer of funding conditions going forward |
source :bloomberg
source : bloomberg
|

